Trading Macro Windows by BW v2
Trading Macros by BW: Integrating ICT Concepts for Session Analysis
This indicator combines two key Inner Circle Trader (ICT) concepts—Change in State of Delivery (CISD) or Inverted Fair Value Gap (IFVG) signals with Macro Time Windows—to provide a unified tool for analyzing intraday price action, particularly during Pacific Time (PT) sessions. Rather than simply merging existing scripts, this integration creates a cohesive visual framework that highlights how macro consolidation periods interact with potential reversal or continuation signals like CISD or IFVG. By overlaying macro candle styling and borders on the chart alongside selectable signal lines, traders can better contextualize setups within ICT's macro narrative, where price often manipulates liquidity during these windows before displacing toward higher-timeframe objectives.
Core Components and How They Work Together:
Macro Time Windows (Inspired by ICT's Macro Periods):
ICT emphasizes "macro" as 30-minute windows (e.g., 06:45–07:15 PT, 07:45–08:15 PT, up to 11:45–12:15 PT) where price tends to consolidate, sweep liquidity, or form key structures like Fair Value Gaps (FVGs). These periods set the stage for the session's directional bias.
The indicator styles candles within these windows using a user-defined color for wicks, borders, and bodies (translucent for visibility). This visual emphasis helps traders focus on activity inside macros, where reversals or continuations often originate.
Borders are drawn as vertical lines at the start and end of each window (with a +5 minute buffer to capture related activity), using a dotted style by default. This creates a "study zone" that encapsulates macro events, allowing traders to assess if price is respecting or violating these zones in alignment with broader ICT models like the Power of 3 (AMD cycle).
Toggle: "Macro Candles Enabled" (default: true) – Turn off to disable styling and borders if focusing solely on signals.
CISD or IFVG Signals (Selectable Mode):
Mode Selection: Choose between "Change in the State of Delivery" (CISD) or "IFVG" (default: IFVG). Both detect shifts in market delivery during specific 30-minute slices (15–45 or 17–45 minutes past the hour in PT sessions).
CISD Mode: Based on ICT's definition of a sudden directional shift, this identifies aggressive displacements after sweeping recent highs/lows. It uses a rolling reference high/low over 6 bars, checks for sweeps (penetrating by at least 2 ticks in the last 2-3 bars), reclamation (closing beyond the reference with at least 50% body), and displacement (50% of prior range or an immediate FVG of 6+ ticks). Signals plot a horizontal line from the close, extending 24 bars right, labeled "CISD."
IFVG Mode: Focuses on Inverted Fair Value Gaps, where a bullish FVG (low > high by 13+ ticks) forms but is inverted (closed below) in the same slice, signaling bearish intent (or vice versa). This targets violations against opposing liquidity, often leading to raids on external ranges. Signals plot similarly, labeled "IFVG."
Shared Logic: Both modes enforce a 55-bar cooldown to prevent clustering, operate only during PT sessions (06:30–13:00), and use tick-based thresholds for precision across instruments. The integration with macros allows traders to see if signals occur within or at the edges of macro windows, enhancing confirmation—for example, a CISD inside a macro might indicate a manipulated reversal toward the session's true objective.
Toggle: "Signals Enabled" (default: true) – Turn off to hide all signal lines and labels, isolating the macro visualization.
How Components Interact:
Macro windows provide the "narrative context" (consolidation/manipulation), while CISD/IFVG signals detect the "delivery shift" (displacement). Together, they form a mashup that justifies publication: isolated signals can be noisy, but when filtered by macro periods, they align with ICT's session model. For instance, an IFVG inversion during a macro might confirm a liquidity sweep before targeting PD arrays or order blocks.
No external dependencies; all calculations are self-contained using Pine's built-in functions like ta.highest/lowest for references and time-based sessions for windows.
Usage Guidelines:
Apply to intraday charts (e.g., 1-5 min) or stocks during PT hours.
Look for confluence: A bull IFVG signal post-macro low sweep might target the next macro high or daily bias.
Customize colors/styles for signals (solid/dashed/dotted lines) and macros to suit your chart.
Backtest in replay mode to observe how macros frame signals—e.g., price often respects macro borders as S/R.
Limitations: Timezone-fixed to PT (America/Los_Angeles); signals are directional hints, not trade entries. Combine with ICT tools like order blocks or liquidity pools for full setups.
This script draws from community ICT implementations but refines them into a single, purpose-built tool for macro-driven trading, reducing chart clutter while emphasizing interconnected concepts. Feedback welcome!
Search in scripts for "order block"

Institutional Analyst LLM📊 Institutional Analyst Board LLM – Smart Money Confluence Scanner for XAUUSD, Forex, Crypto 🔍 Overview The Institutional Analyst Board is a complete multi-timeframe smart money toolkit designed for traders who demand clarity, confluence, and precision. It brings together institutional-grade metrics—Order Blocks (OB), Fair Value Gaps (FVG), Liquidity Sweeps, MACD/RSI...
PTS Ultimate Analysis Board (Flexible Position + Ticker)
GoldenTradeClub
GoldenTradeClub
Updated
Jul 15
PTS Ultimate Analysis Board (Flexible Position + Ticker) Version: Pine v5 Description: This indicator builds a fully customizable, multi-timeframe dashboard table that surfaces 19 key metrics for any ticker (current chart TF, 1 h, 4 h). You can position the table at the top-right or bottom-right of your chart and toggle each metric on or off. Key...
Trading Engine AI Light
GoldenTradeClub
GoldenTradeClub
Jul 14
The Trading Engine includes the best and most effective technical analysis tools. It has 27 different Buy Signal parameters and 26 different Sell Signal parameters. Furthermore, it also has 9 Stop Loss triggers for Long Positions and 8 Stop Loss triggers for Short Positions. Many of the Buy or Sell Signal parameters function as Take Profit and Stop Loss signals...
Elliott Wave Complete
GoldenTradeClub
GoldenTradeClub
Jul 4
1. Indicator Presentation Name: Elliott Wave Complete Type: Pine Script v5 overlay dashboard for TradingView Purpose: Automates Elliott Wave motive (1-5) and corrective (A-B-C) pattern detection on any timeframe, enriches it with classic ZigZag pivots, dynamic Fibonacci projection levels, optional wave-count info box, and real-time alerts—all in one...
💀⚡ PTS WIZARD 666™ ULTIMATE SUPREME V5.0 - COMPLETE FIXED ⚡💀
GoldenTradeClub
GoldenTradeClub
Jul 4
1. Indicator Presentation Name: 💀⚡ PTS WIZARD 666™ ULTIMATE SUPREME V5.0 – COMPLETE FIXED Short ID: PTS-666-SUPREME Type: Pine Script v5 overlay dashboard for TradingView Purpose: An all-in-one trading overlay that integrates advanced WaveTrend momentum, RSI/MFI analysis, POC volume profiling, multiple Fibonacci golden/ultimate zones, volume footprint & imbalance...
🔥 PTS TRADE 666™ ULTIMATE BOOKMAP + QUANTUM ENGINE
GoldenTradeClub
GoldenTradeClub
Jul 4
1. Indicator Presentation Name: 🔥 PTS TRADE 666™ ULTIMATE BOOKMAP + QUANTUM ENGINE Short ID: PTS666_QUANTUM_FINAL Type: Pine Script v5 overlay dashboard for TradingView Purpose: A cutting-edge, institutional-grade suite that unifies bookmap-style footprint volume profiling, dynamic heatmap liquidity analysis, AI-driven pattern recognition, smart-money protocols,...
🔥 PTS TRADE 666™ - ULTIMATE INSTITUTIONAL TOOL 🔥
GoldenTradeClub
GoldenTradeClub
Jul 4
1. Indicator Presentation Name: 🔥 PTS TRADE 666™ – ULTIMATE INSTITUTIONAL TOOL V2.0 Short ID: PTS666_UIT_V2 Type: Pine Script v5 overlay dashboard for TradingView Purpose: Combines institutional-grade footprint volume analysis, smart-money structure detection, statistical anomaly checks, multi-timeframe divergence, Ichimoku insights, pattern recognition, and an...
PTS Wizard
GoldenTradeClub
GoldenTradeClub
Jul 4
1. Indicator Presentation Name: PTS Wizard Short Title: PTS Wizard Type: Pine Script v5 overlay dashboard for TradingView Purpose: A unified multi-strategy toolkit that overlays key market insights—liquidity zones, smart-money structure, footprint-style volume profile, consolidation ranges, statistical deviation bands, price forecasts, and session analysis—into a...
🔥 PTS.TRADE 666™ ULTIMATE HYBRID + MTF V3
GoldenTradeClub
GoldenTradeClub
Jul 4
1. Indicator Presentation Name: 🔥 PTS.TRADE 666™ ULTIMATE HYBRID + MTF V3 Short ID: PTS666_ULTIMATE_MTF_V3 Type: Overlay dashboard for TradingView Purpose: A next-level hybrid trading suite that merges institutional-grade order-flow analysis, smart-money concepts, AI-driven insights, classic momentum oscillators (WaveTrend, divergence, “Gold” signals),...
🧙♂ PTS WIZARD V3.0 - FINAL EDITION
GoldenTradeClub
GoldenTradeClub
Jul 4
1. Indicator Presentation Name: 🧙♂ PTS WIZARD V3.0 – FINAL EDITION Short Title: PTS-WIZARD-V3-FINAL Type: Overlay trading dashboard for TradingView Purpose: A comprehensive multi-module indicator that blends classic cipher momentum signals, Elliott Wave pattern detection, advanced statistical analyses (Z-Score, Benford’s Law, Ehlers SNR), footprint-style volume...
🧙♂ PTS WIZARD V3.0 + FOOTPRINT ULTIMATE
GoldenTradeClub
GoldenTradeClub
Jul 4
Name: PTS WIZARD V3.0 + FOOTPRINT ULTIMATE Type: Overlay trading dashboard for TradingView Purpose: Combines classic cipher-style momentum signals with an advanced footprint volume profile, multi-timeframe bias, statistical filters, and a fusion-score system—displayed in a customizable on-chart dashboard. Core Modules Cipher Momentum Signals WaveTrend...
🧙♂ PTS WIZARD V3.0 - BASIC
GoldenTradeClub
GoldenTradeClub
Jul 1
PTS WIZARD V3.0 Basic – Ultimate Multi-Tool Trading Dashboard An all-in-one overlay combining classic cipher signals, Elliott Wave pattern detection, volume analytics, divergence spotting, and smart-entry timing—backed by advanced statistical filters and a live dashboard. Key Features Cipher Signals WaveTrend with overbought/oversold zones & cross signals RSI...
Trading Engine vCD AI
GoldenTradeClub
GoldenTradeClub
Jun 15
The Trading Engine includes the best and most effective technical analysis tools. It has 27 different Buy Signal parameters and 26 different Sell Signal parameters. Furthermore, it also has 9 Stop Loss triggers for Long Positions and 8 Stop Loss triggers for Short Positions. Many of the Buy or Sell Signal parameters function as Take Profit and Stop Loss signals...
Trading Engine vCD
GoldenTradeClub
GoldenTradeClub
Updated
Mar 21
The Trading Engine includes the best and most effective technical analysis tools. It has 27 different Buy Signal parameters and 26 different Sell Signal parameters. Furthermore, it also has 9 Stop Loss triggers for Long Positions and 8 Stop Loss triggers for Short Positions. Many of the Buy or Sell Signal parameters function as Take Profit and Stop Loss signals...
TE CLIENT v13
GoldenTradeClub
GoldenTradeClub
Updated
Mar 15
The Trading Engine includes the best and most effective technical analysis tools. It has 27 different Buy Signal parameters and 26 different Sell Signal parameters. Furthermore, it also has 9 Stop Loss triggers for Long Positions and 8 Stop Loss triggers for Short Positions. Many of the Buy or Sell Signal parameters function as Take Profit and Stop Loss signals...
Trading Engine v13
GoldenTradeClub
GoldenTradeClub
Updated
Mar 15
The Trading Engine includes the best and most effective technical analysis tools. It has 27 different Buy Signal parameters and 26 different Sell Signal parameters. Furthermore, it also has 9 Stop Loss triggers for Long Positions and 8 Stop Loss triggers for Short Positions. Many of the Buy or Sell Signal parameters function as Take Profit and Stop Loss signals...
Trading Engine B2B
GoldenTradeClub
GoldenTradeClub
Updated
Jan 14
The Trading Engine includes the best and most effective technical analysis tools. It has 25 different Buy Signal parameters and 24 different Sell Signal parameters. Furthermore, it also has 9 Stop Loss triggers for Long Positions and 8 Stop Loss triggers for Short Positions. Many of the Buy or Sell Signal parameters function as Take Profit and Stop Loss signals...
Trading Engine B2B FX V9
GoldenTradeClub
GoldenTradeClub
Updated
Jan 14
The VFLOW Trading Engine includes the best and most effective technical analysis tools. It has 20 different Buy Signal parameters and 18 different Sell Signal parameters. Furthermore, it also has 7 Stop Loss triggers for Long Positions and 5 Stop Loss triggers for Short Positions. Many of the Buy or Sell Signal parameters function as Take Profit and Stop Loss...
English
Select market data provided by ICE Data services.
Select reference data provided by FactSet. Copyright © 2025 FactSet Research Systems Inc.
© 2025 TradingView, Inc.
More than a product
Supercharts
Screeners
Stocks
ETFs
Bonds
Crypto coins
CEX pairs
DEX pairs
Pine
Heatmaps
Stocks
ETFs
Crypto
Calendars
Economic
Earnings
Dividends
More products
Yield Curves
Options
News Flow
Pine Script®
Apps
Mobile
Desktop
Tools & subscriptions
Features
Pricing
Market data
Trading
Overview
Brokers
Special offers
CME Group futures
Eurex futures
US stocks bundle
About company
Who we are
Athletes
Blog
Careers
Media kit
Merch
TradingView store
Tarot cards for traders
The C63 TradeTime
Policies & security
Terms of Use
Disclaimer
Privacy Policy
Cookies Policy
Accessibility Statement
Security tips
Bug Bounty program
Status page
Community
Social network
Wall of Love
Refer a friend
House Rules
Moderators
Ideas
Trading
Education
Editors' picks
Pine Script
Indicators & strategies
Wizards
Freelancers
Business solutions
Widgets
Charting libraries
Lightweight Charts™
Advanced Charts
Trading Platform
Growth opportunities
Advertising
Brokerage integration
Partner program
Education program
Look First
Close
Updated 3 hours ago
Institutional Analyst Board
Manage access
Remove from favorites
Use on chart
0
11
Jul 19
📊 Institutional Analyst Board – Smart Money Confluence Scanner for XAUUSD, Forex, Crypto
🔍 Overview
The Institutional Analyst Board is a complete multi-timeframe smart money toolkit designed for traders who demand clarity, confluence, and precision. It brings together institutional-grade metrics—Order Blocks (OB), Fair Value Gaps (FVG), Liquidity Sweeps, MACD/RSI bias, VWAP positioning, and Break of Structure (BoS)—into a single powerful visual dashboard.
This indicator is especially optimized for Gold (XAUUSD) but is also compatible with Crypto and Forex assets.
🧠 Key Features
✅ Multi-Timeframe Dashboard (5M / 15M / 1H)
✅ Order Block Detection with dynamic zones that extend until broken
✅ Fair Value Gap Detection with clear zone shading and border distinction
✅ MACD + RSI Confluence for momentum and bias alignment
✅ VWAP Positioning to identify premium/discount zones
✅ Liquidity Sweeps (internal/external range breaks)
✅ Killzone Highlighting (Asia / London / New York)
✅ Break of Structure (BoS) with advanced confluence filters
✅ Gold Bias Flags across timeframes (BUY / SELL / NEUTRAL)
✅ Dynamic Price Watermark with real-time data
✅ Fully customizable colors, transparencies, and text labels
🧠 How It Works
The Board uses institutional logic to analyze the chart in real time:
Metric Purpose
OB Zones Highlight potential smart money footprints where price is likely to react.
FVG Zones Identify imbalance areas between buyers and sellers—ideal for mean reversion entries.
MACD/RSI Confirm momentum direction and relative strength confluence.
VWAP Determine whether price is trading at a premium or discount.
Liquidity Sweeps Detect manipulative moves before major reversals.
BoS Mark potential trend reversals, filtered by institutional confluence.
Each signal is computed across 3 timeframes and visualized in a clean board that updates live. You’ll also see labels, alerts, and session overlays for maximum clarity.
📌 Ideal Use Case
This tool is perfect for:
Funded Challenge Traders (FTMO, MyForexFunds, etc.)
Gold scalpers and intraday traders
Crypto price action traders using BTC, ETH, SOL, etc.
Smart Money Concept (SMC) and ICT followers
⚙️ Customization Options
Toggle each module (OB, FVG, VWAP, MACD/RSI, etc.)
Set transparency and color for each zone type
Adjust Killzone timing (Asia, London, NY)
Control board position (Top/Bottom) and metric visibility
📈 Compatible Assets
✅ XAUUSD (optimized)
✅ Forex majors/minors
✅ Crypto pairs (BTC, ETH, SOL, etc.)
✅ Indices (GER40, NASDAQ, SPX with minor adaptation)
🛠️ Requirements
Use on TradingView v5
Set chart time to UTC+0 or UTC+3 for optimal Killzone accuracy
For crypto, redefine Killzone hours if needed (24/7 market)
🧠 Pro Tip
Pair this indicator with volume profile tools, CVD/Delta Flow, or Footprint overlays to build high-confidence trade setups with clear institutional confluence.

Structure Pro+ (BOS, CHoCH, FVG, OB)Structure Pro+ (BOS, CHoCH, FVG, OB)
Structure Pro+ is a comprehensive Pine Script indicator designed for traders who utilize Smart Money Concepts (SMC) in their analysis. This powerful tool automatically identifies and visualizes key market structure elements, helping you gain deeper insights into price action and potential institutional movements.
Key Features:
Break of Structure (BOS): Clearly identifies trend continuation by marking points where price breaks a previous swing high in an uptrend or a swing low in a downtrend.
Change of Character (CHoCH): Pinpoints potential trend reversals when price breaks a swing point against the prevailing trend, signaling a shift in market sentiment.
Fair Value Gap (FVG) / Imbalance: Automatically highlights areas where price has moved quickly, leaving behind "imbalances" that often act as magnet zones for future price action.
Mitigation Logic: FVGs are dynamically tracked and can be set to disappear from the chart once mitigated (when price returns to fill the gap).
Order Block (OB): Detects and marks potential institutional order blocks, which are crucial supply and demand zones that frequently act as strong support or resistance levels.
Customizable Settings: Tailor the indicator to your specific trading style with extensive input options, including:
Pivot sensitivity (leftBars, rightBars)
Color and line style for BOS/CHoCH
FVG display options, including color and mitigation behavior
Order Block display options and colors
Label sizing for clarity
Integrated Alerts: Stay informed with built-in alert functionalities for:
BOS occurrences (Bullish/Bearish)
CHoCH occurrences (Bullish/Bearish)
Confluent events: BOS + FVG and CHoCH + FVG, providing high-probability trade setups when structure breaks align with imbalances. The confluenceLookback setting allows you to define the maximum distance between these events for an alert.
Why Use Structure Pro+?
This indicator simplifies the complex process of identifying SMC concepts on your charts. By automatically drawing BOS, CHoCH, FVG, and OB, Structure Pro+ helps you:
Validate your directional bias with clear visual cues.
Identify potential entry and exit points around significant structural levels.
Enhance your market understanding based on institutional footprints.
Receive timely notifications for high-probability setups, so you never miss a critical market event.
Structure Pro+ is an invaluable tool for any trader looking to refine their analysis with Smart Money Concepts.

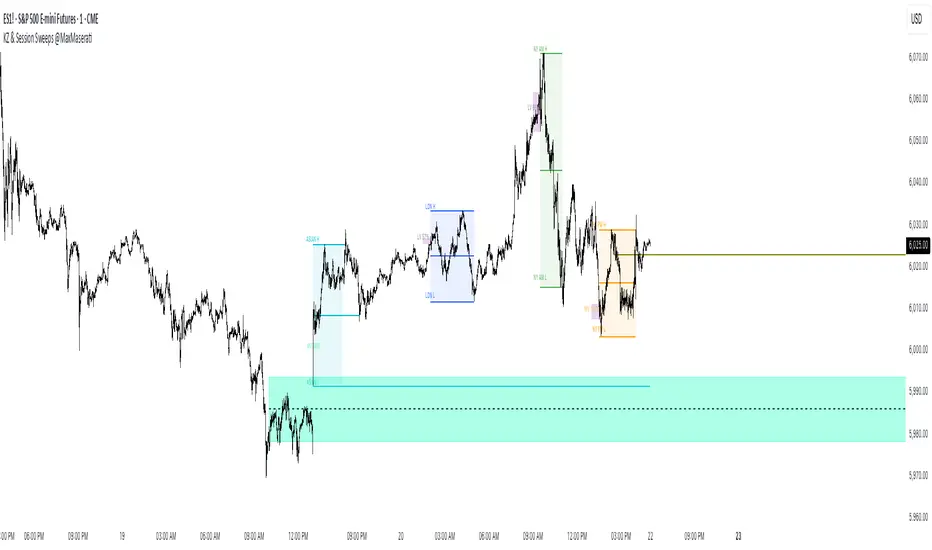
ICT Killzones Bias & Volume Sweeps @MaxMaserati📌 Overview
This indicator helps traders identify key ICT Killzones (Asian, London, NY AM, NY PM sessions) along with volume analysis and sweep detection. It highlights institutional order blocks, tracks session bias, and detects liquidity sweeps with volume confirmation.
Key Features:
✅ ICT Killzones (Asian, London, NY AM, NY PM)
✅ Volume Analysis (High/Low volume detection)
✅ Sweep Detection (Buyside/Sellside sweeps with volume confirmation)
✅ Session Bias (Bullish/Bearish bias based on price action)
✅ Customizable Sessions (Add personal trading hours)
✅ Institutional Order Build-up (30-min pre-session accumulation zones)
⚙️ Input Settings
1. Timezone Settings
Chart Timezone: Adjust to your local timezone (default: New York).
2. Session Toggles
Asian / London / NY AM / NY PM Sessions: Enable/disable each session.
NY Lunch Session: Optional session (disabled by default).
Personal Trading Time: Customize your trading hours.
3. Label Settings
Label Size: Tiny, Small, Normal, Large.
Session Labels: Customize text for High (H), Low (L), Mid (M) labels.
Background Transparency: Adjust session box opacity.
4. Volume Analysis
Show Volume Labels: Displays volume strength (🚀 Very High, 🔥 High, ⚖️ Normal, 💤 Low, 🐢 Very Low).
Volume Lookback Period: Adjusts volume comparison window.
High/Low Volume Thresholds: Define what constitutes high/low volume.
5. Sweep Detection
Buyside/Sellside Sweeps: Highlights liquidity sweeps.
Sweep Margin: Adjust sensitivity for sweep detection.
Fake Sweep Zones: Option to hide or highlight fakeouts.
Example of Session Sweep and Volume:
Here we have a Bullish Sweep of London Low session by NY AM
However, the volume was low suggesting buyers are not strong enough (M1)
And then the sellers took over and a pressure retest by the buyers of the level and then sellers entered with more power/pressure
6. Session Momentum & Bias
Show Session Bias: Indicates bullish/bearish bias for each session.
Bias Strength Threshold: Adjust sensitivity for bias detection.
📊 How It Works
1. Session Highs/Lows
The indicator tracks High, Low, and Mid prices for each session.
Lines and boxes are drawn to visualize the session range.
2. Volume Analysis
Compares current volume to historical average.
Displays volume strength with emojis (🚀, 🔥, ⚖️, 💤, 🐢).
Highlights high-volume sweeps for confirmation.
3. Sweep Detection
Detects buyside sweeps (liquidity above highs) and sellside sweeps (liquidity below lows).
Sweep zones expand if price lingers near the swept level.
4. 30 minute Pre-session Institutional order buildup
Highlights 30-minute pre-session zones where institutions may accumulate orders.
5. Session Bias
Calculates bias based on open/close price action within the session.
Displays Bullish, Bearish, or Neutral labels.
]
🎯 Trading Applications
1. Liquidity Sweeps
Look for sweeps with high volume as confirmation of institutional activity.
Fade fake sweeps (if enabled) when price reverses quickly.
2. Session Breakouts
Trade breakouts from Asian/London ranges during NY sessions.
Watch for volume expansion on breakouts for confirmation.
3. Pre- Session Institutional Block
Price often reacts to pre-session institutional position build-up (30-min before session opens).
LV:Low Volume, HV: High volume and MV: Medium Volume
NY AM Pre-Session institutional Order Build-up block with high sweep
🔧 Customization Tips
Adjust session times to normal future sessions to match your trading style.
Modify sweep sensitivity if too many/too few sweeps are detected.
Use volume thresholds to fine-tune high/low volume alerts.
📌 Final Notes
This indicator combines ICT concepts with volume analysis for a powerful trading edge. Use it alongside price action and market structure for best results at your own risk.
ICT Macro Zone Boxes w/ Individual H/L Tracking v3.1ICT Macro Zones (Grey Box Version
This indicator dynamically highlights key intraday time-based macro sessions using a clean, minimalistic grey box overlay, helping traders align with institutional trading cycles. Inspired by ICT (Inner Circle Trader) concepts, it tracks real-time highs and lows for each session and optionally extends the zone box after the session ends — making it a precision tool for intraday setups, order flow analysis, and macro-level liquidity sweeps.
### 🔍 **What It Does**
- Plots **six predefined macro sessions** used in Smart Money Concepts:
- AM Macro (09:50–10:10)
- London Close (10:50–11:10)
- Lunch Macro (11:30–13:30)
- PM Macro (14:50–15:10)
- London SB (03:00–04:00)
- PM SB (15:00–16:00)
- Each zone:
- **Tracks high and low dynamically** throughout the session.
- **Draws a consistent grey shaded box** to visualize price boundaries.
- **Displays a label** at the first bar of the session (optional).
- **Optionally extends** the box to the right after the session closes.
### 🧠 **How It Works**
- Uses Pine Script arrays to define each session’s time window, label, and color.
- Detects session entry using `time()` within a New York timezone context.
- High/Low values are updated per bar inside the session window.
- Once a session ends, the box is optionally closed and fixed in place.
- All visual zones use a standardized grey tone for clarity and consistency across charts.
### 🛠️ **Settings**
- **Shade Zone High→Low:** Enable/disable the grey macro box.
- **Extend Box After Session:** Keep the zone visible after it ends.
- **Show Entry Label:** Display a label at the start of each session.
### 🎯 **Why This Script is Unique**
Unlike basic session markers or colored backgrounds, this tool:
- Focuses on **macro moments of liquidity and reversal**, not just open/close times.
- Uses **per-session logic** to individually track price behavior inside key time windows.
- Supports **real-time high/low tracking and clean zone drawing**, ideal for Smart Money and ICT-style strategies.
Perfect — based on your list, here's a **bundle-style description** that not only explains the function of each script but also shows how they **work together** in a Smart Money/ICT workflow. This kind of cross-script explanation is exactly what TradingView wants to see to justify closed-source mashups or interdependent tools.
---
📚 ICT SMC Toolkit — Script Integration Guide
This set of advanced Smart Money Concept (SMC) tools is designed for traders who follow ICT-based methodologies, combining liquidity theory, time-based precision, and engineered confluences for high-probability trades. Each indicator is optimized to work both independently and synergistically, forming a comprehensive trading framework.
---
First FVG Custom Time Range
**Purpose:**
Plots the **first Fair Value Gap (FVG)** that appears within a defined session (e.g., NY Kill Zone, Custom range). Includes optional retest alerts.
**Best Used With:**
- Use with **ICT Macro Zones (Grey Box Version)** to isolate FVGs during high-probability times like AM Macro or PM SB.
- Combine with **Liquidity Levels** to assess whether FVGs form near swing points or liquidity voids.
---
ICT SMC Liquidity Grabs and OB s
**Purpose:**
Detects **liquidity grabs** (stop hunts above/below swing highs/lows) and **bullish/bearish order blocks**. Includes optional Fibonacci OTE levels for sniper entries.
**Best Used With:**
- Use with **ICT Turtle Soup (Reversal)** for confirmation after a liquidity grab.
- Combine with **Macro Zones** to catch order blocks forming inside timed macro windows.
- Match with **Smart Swing Levels** to confirm structure breaks before entry.
ICT SMC Liquidity Levels (Smart Swing Lows)
**Purpose:**
Automatically marks swing highs/lows based on user-defined lookbacks. Tracks whether those levels have been breached or respected.
**Best Used With:**
- Combine with **Turtle Soup** to detect if a swing level was swept, then reversed.
- Use with **Liquidity Grabs** to confirm a grab occurred at a meaningful structural point.
- Align with **Macro Zones** to understand when liquidity events occur within macro session timing.
ICT Turtle Soup (Liquidity Reversal)
**Purpose:**
Implements the classic ICT Turtle Soup model. Looks for swing failure and quick reversals after a liquidity sweep — ideal for catching traps.
Best Used With:
- Confirm with **Liquidity Grabs + OBs** to identify institutional activity at the reversal point.
- Use **Liquidity Levels** to ensure the reversal is happening at valid previous swing highs/lows.
- Amplify probability when pattern appears during **Macro Zones** or near the **First FVG**.
ICT Turtle Soup Ultimate V2
**Purpose:**
An enhanced, multi-layer version of the Turtle Soup setup that includes built-in liquidity checks, OTE levels, structure validation, and customizable visual output.
**Best Used With:**
- Use as an **entry signal generator** when other indicators (e.g., OBs, liquidity grabs) are aligned.
- Pair with **Macro Zones** for high-precision timing.
- Combine with **First FVG** to anticipate price rebalancing before explosive moves.
---
## 🧠 Workflow Example:
1. **Start with Macro Zones** to focus only on institutional trading windows.
2. Look for **Liquidity Grabs or Swing Sweeps** around key highs/lows.
3. Check for a **Turtle Soup Reversal** or **Order Block Reaction** near that level.
4. Confirm confluence with a **Fair Value Gap**.
5. Execute using the **OTE level** from the Liquidity Grabs + OB script.
---
Let me know which script you want to publish first — I’ll tailor its **individual TradingView description** and flag its ideal **“Best Used With” partners** to help users see the value in your ecosystem.

Rawstocks 15 Minute ModelRawstocks 15-Minute Model
The Rawstocks 15-Minute Model is a precision intraday trading strategy designed for the US stock market (9:30 AM - 4:00 PM ET), optimized for the 15-minute timeframe. It combines institutional order flow concepts with Fibonacci retracements to identify high-probability reversal setups while enforcing strict risk management and session-based rules.
Key Features
Time-Based Execution
Trading Hours: 9:30 AM - 4:00 PM ET (no new entries after 4:00 PM)
Force Close: All positions auto-exit at 4:30 PM ET (prevents overnight risk)
Entry Logic
Order Block + Fib Confluence:
Identifies institutional order blocks (previous swing highs/lows)
Requires price pullback to 61.8% or 79% Fibonacci level
Liquidity Confirmation:
Waits for stop runs (liquidity sweeps) before reversal entries
Exit Rules
Stop Loss: 1x ATR (14) from entry
Take Profit: 2:1 Risk-Reward (adjustable)
Visual Signals
Green Triangle: Valid long setup (pullback to bullish OB + Fib)
Red Triangle: Valid short setup (pullback to bearish OB + Fib)
Blue/Purple Background: Highlights active trading vs. close period
How It Works
Identify the Setup
Wait for a strong impulse move (break of structure)
Mark the order block (institutional zone)
Confirm Pullback
Price must retrace to 61.8% or 79% Fib level
Must occur within trading hours (9:30 AM - 4:00 PM)
Enter on Confirmation
Long: Break of pullback candle high (stop below recent swing low)
Short: Break of pullback candle low (stop above recent swing high)
Manage the Trade
Trail stop or exit at 2R (risk-to-reward)
All positions close at 4:30 PM sharp

DOP - Load-Level Identification & Setup Assistant (L.I.S.A)This toolkit is made up of more than 3+ innovative indicators that have been designed to assist people in trading smart-money concepts. Get access to a variety of trading tools & relevant data all within one indicator to create your own, smart-money trading strategy.
Catering To SMART-Money Trading Styles
Our toolkit works in any market & allows users to:
• Detect the trend of the market by displaying real-time changes in market structure.
• Detect institutional activity in the market by highlighting structural changes.
• Get automatic order block support and resistance levels in real-time to assist with order entry placement and target take profit levels.
• Timely removal of order blocks that have been run through to give a clear picture of current market structure.
How Does It Work?
The algorithm tracks key pivot points within market data and when these are broken by price movements it provides key information to the user such as when it broke structure, where it broke structure and what levels are now considered support and resistance.
Trend Bar Colouring
The trend bar colouring feature provides a clear visual indication of the market trend by colouring candles red or green depending on the last break in market structure.
Market Structure Breaks
Breaks in market structure are displayed with a single line between two candles, this indicates that there may have been a shift in market trend.
Order Block Levels
Once structure breaks it creates support and resistance levels which can help in trade entries and deciding on take profit targets; these are displayed in real-time with colour coded boxes at either the support or resistance levels. If a level has been broken it is automatically removed from the chart to give a clear representation of the current market state.
If you are using this script you acknowledge past performance is not necessarily indicative of future results and there are many more factors that go into being a profitable trader.
You can see the Author's instructions below to get instant-access to this indicator.
HIGH VOLUME BY EAGLE EYESHIGH VOLUME BY EAGLE EYES is a smart price–volume analysis tool that helps traders identify high-probability breakout zones based on consolidation, breakout direction, and volume strength.
Key Features:
Order Block Detection: Finds bullish and bearish order blocks after periods of consolidation.
Volume Analysis: Supports three calculation methods — Simple, Relative (to average volume), and Weighted — to gauge volume strength.
Breakout Filtering: Confirms breakouts only when accompanied by above-threshold volume.
Visual Markers: Plots color-coded boxes on the chart showing the breakout zone with live volume multipliers.
Customizable Settings: Adjustable lookback periods, breakout threshold, maximum number of displayed blocks, and volume sensitivity.
Usage:
Apply to your chart with your desired timeframe.
Watch for green boxes (bullish breakouts) and red boxes (bearish breakouts).
Boxes are removed if price mitigates them (invalidated by opposite movement).
Works on all instruments and timeframes, especially effective in volatile markets for breakout traders.

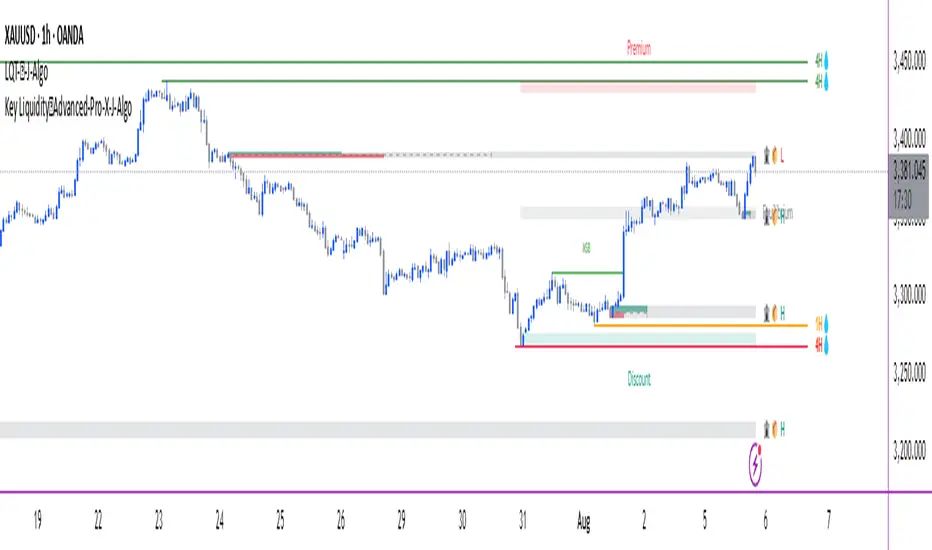
Key Liquidity💧Advanced-Pro-J-Algo# 💧 Key Liquidity Advanced Pro - Multi-Timeframe Institutional Analysis
## 🏆 **Premium Institutional Trading Indicator**
Transform your trading with this comprehensive **multi-timeframe liquidity analysis tool** that combines **Smart Money Concepts (SMC)** and **ICT methodology** into one powerful indicator. Designed for serious traders who demand institutional-grade analysis.
---
## 🔥 **Key Features**
### 💧 **Multi-Timeframe Key Liquidity Levels**
- **HTF (Higher Timeframe)**: Major institutional levels with real-time alerts 🚨
- **LTF (Lower Timeframe)**: Precision entry/exit levels for optimal timing
- **CTF (Current Timeframe)**: Flexible analysis for any chart timeframe
- **Smart Mitigation Detection**: Automatically removes hit liquidity levels
- **Professional Labels**: Clean timeframe identification (4H, 1H, etc.)
### 🏦 **Institutional Order Blocks**
- **📦 Smart Money Order Blocks**: Identify where institutions placed large orders
- **Volume-Weighted Analysis**: Bullish/Bearish strength calculations
- **Professional Labels**: 🏦📦 H (High) and 🏦📦 L (Low) markers
- **Violation Detection**: Automatic cleanup when order blocks are broken
- **Overlap Prevention**: Clean chart presentation without clutter
### 🚨 **Advanced Alert System**
- **HTF Liquidity Hit Alerts**: Never miss major institutional level breaks
- **Detailed Notifications**: Timeframe, price, and timestamp information
- **Smart Frequency Control**: No spam - only meaningful alerts
- **Mobile Ready**: Perfect for Trading View mobile app notifications
### 📊 **Market Structure Analysis**
- **MSB (Market Structure Breaks)**: Current trend direction changes
- **Premium/Discount Zones**: ICT-style institutional price zones
- **Clean Presentation**: Only shows current MSB, removes historical clutter
### 🔄 **Trading Session Analysis**
- **Multi-Session Support**: Asian, London, New York sessions
- **Session Overlaps**: Highlighted with special bar coloring
- **Configurable Display**: Show 0-10 previous days of session data
- **High/Low Tracking**: Session-specific price levels
---
## 🎯 **Perfect For**
### **Trading Styles:**
- ✅ **Forex Trading** (ICT/SMC methodology)
- ✅ **Index Trading** (institutional analysis)
- ✅ **Crypto Trading** (smart money concepts)
- ✅ **Swing Trading** (HTF liquidity levels)
- ✅ **Scalping** (multi-timeframe precision)
### **Methodologies:**
- ✅ **Smart Money Concepts (SMC)**
- ✅ **Inner Circle Trader (ICT)**
- ✅ **Institutional Order Flow**
- ✅ **Liquidity Hunting Strategies**
- ✅ **Market Structure Trading**
---
## ⚙️ **Comprehensive Settings**
### **Master Controls:**
- 💧 Enable/Disable Key Liquidity Levels
- 🏦 Enable/Disable Order Blocks
- 📊 Enable/Disable Market Structure Breaks
- 🎯 Enable/Disable Premium/Discount Zones
- 🔄 Enable/Disable Trading Sessions
### **Customization Options:**
- **Timeframe Selection**: Choose your HTF and LTF periods
- **Color Schemes**: Professional color coding for each timeframe
- **Display Limits**: Control chart clutter with smart limits
- **Text Sizing**: Scalable labels for any screen size
- **Extension Options**: Short, Current, or Max line extensions
### **Alert Configuration:**
- 🚨 HTF High Liquidity Hit Alerts
- 🚨 HTF Low Liquidity Hit Alerts
- Smart frequency control to prevent spam
---
## 🎨 **Visual Excellence**
### **Professional Design:**
- **Clean Interface**: No chart clutter, only relevant information
- **Consistent Labeling**: All elements perfectly aligned and positioned
- **Smart Color Coding**: Visual hierarchy based on timeframe importance
- **Emoji Integration**: Instant visual recognition (💧🏦📦📊)
### **Label System:**
- **Liquidity Levels**: Timeframe labels (4H, 1H, etc.) with tooltips
- **Order Blocks**: 🏦📦 H/L institutional liquidity markers
- **Market Structure**: MSB break notifications
- **Sessions**: Clear session identification and overlaps
---
## 🔬 **Technical Implementation**
### **Performance Optimized:**
- Efficient memory management with `max_bars_back()` settings
- Smart array handling to prevent performance issues
- Clean object deletion to maintain chart responsiveness
### **Advanced Logic:**
- **Pivot Detection**: Sophisticated swing high/low identification
- **Mitigation Algorithms**: Smart detection of liquidity level hits
- **Volume Analysis**: Institutional strength calculations
- **Multi-Timeframe Security**: Proper HTL/LTF data handling
---
## 📈 **How to Use**
### **Setup:**
1. Add indicator to your chart
2. Configure your preferred HTF (default: 4H) and LTF (default: 1H)
3. Enable desired features via Master Controls
4. Set up TradingView alerts for HTF liquidity hits
### **Trading Workflow:**
1. **Identify Bias**: Use HTF liquidity levels for market direction
2. **Find Entries**: Use LTF levels and Order Blocks for precision entries
3. **Confirm Structure**: Check MSB for trend continuation/reversal
4. **Time Entries**: Use session analysis for optimal timing
5. **Get Alerted**: Never miss major HTF liquidity hits
---
## 🏅 **Why Choose This Indicator?**
### **Professional Grade:**
- Combines multiple premium concepts into one comprehensive tool
- Institutional-quality analysis typically found in expensive platforms
- Clean, professional presentation suitable for serious trading
### **Complete Solution:**
- No need for multiple indicators - everything in one package
- Covers all aspects of modern institutional trading methodology
- Suitable for beginners learning SMC/ICT and professionals alike
### **Constantly Updated:**
- Built with modern Pine Script v6
- Performance optimized for all timeframes
- Clean code structure for reliability
---
## 🚨 **Important Notes**
- **Timeframe Compatibility**: Works on all intraday timeframes (not suitable for daily/weekly/monthly)
- **Best Performance**: Recommended for 1m-4H chart timeframes
- **Alert Setup**: Configure TradingView alerts for mobile notifications
- **Education**: Best used with understanding of SMC/ICT concepts
---
## 📞 **Support & Updates**
This indicator represents months of development and testing, combining the best of institutional trading analysis into one comprehensive tool. Perfect for traders who demand professional-grade analysis and real-time alerting.
**🎯 Take your trading to the institutional level with Key Liquidity Advanced Pro!**
---
*Disclaimer: This indicator is for educational and informational purposes. Past performance does not guarantee future results. Always practice proper risk management.*
Pipsttocra Technical Patterns: EV HV FVG & OBPipstocrat Technical Patterns , identifies and visualizes key technical analysis patterns and structures on a TradingView chart. Here's a simple breakdown of what it does:
Fair Value Gaps (FVG):
Detects and highlights bullish and bearish Fair Value Gaps as colored boxes.
Adds centerline markers to indicate potential price levels.
Order Blocks (OB):
Identifies bullish and bearish order blocks (areas of significant buying or selling).
Displays them as colored rectangles extending to the right of the chart.
Candlestick Patterns:
Detects Engulfing Patterns (bullish and bearish) with volume confirmation.
Highlights Hammer and Inverted Hammer patterns with customizable shapes and colors.
Customization Options:
Allows users to adjust colors, sizes, and styles for all patterns and structures.
Provides options to show/hide specific patterns like FVGs, engulfing candles, hammers, etc.
Alerts:
Generates alerts for detected patterns, such as FVGs, order blocks, engulfing candles, and confluence zones (combination of FVGs and order blocks).
Management Features:
Automatically removes older or "filled" patterns (optional).
Tracks and updates patterns dynamically as new bars form.
Purpose:
This tool helps traders spot high-probability trading opportunities by identifying key market structures (like FVGs and order blocks) and candlestick patterns. It combines multiple technical analysis concepts into one comprehensive indicator for better decision-making.

Wave N + KDJ + Volumi + SMC + IchimokuWave N + KDJ + Volume + SMC + Ichimoku Indicator
Overview
This script is a multi-layered technical indicator designed to provide traders with enhanced market insights by combining five key methodologies:
• Wave N Pattern (Price Action)
• KDJ Oscillator (Momentum)
• Volume Filtering (Confirmation)
• Smart Money Concepts (Order Blocks) (Institutional Activity)
• Ichimoku Cloud (Trend and Support/Resistance)
By integrating these components, the indicator identifies high-probability trading signals, early warnings of trend shifts, and institutional price zones to improve decision-making in volatile markets.
⸻
How It Works
1️⃣ Wave N Pattern (Price Action Structure)
The Wave N pattern is a classic price action formation that helps spot potential trend reversals and continuations:
• A Bullish Wave N is detected when a higher low and a higher high structure appears.
• A Bearish Wave N is detected when a lower high and a lower low structure forms.
2️⃣ KDJ Oscillator (Momentum & Trend Strength)
The KDJ Indicator is a variation of the Stochastic Oscillator that adds a third line, J, to amplify sensitivity to trend movements.
• J > 50 indicates bullish momentum.
• J < 50 indicates bearish momentum.
• The script includes an early warning signal when J crosses 50, suggesting a possible trend shift.
3️⃣ Volume Filtering (Trade Confirmation)
To avoid false signals, the script integrates volume confirmation:
• A signal is valid only if the volume is above the 20-period EMA of volume.
• This ensures that trade signals are supported by strong market participation.
4️⃣ Smart Money Concepts (Order Blocks)
Order Blocks represent areas of institutional interest, where large traders accumulate or distribute positions.
• The script detects bullish order blocks (potential support) and bearish order blocks (potential resistance).
• These areas help identify optimal entry and exit points.
5️⃣ Ichimoku Cloud (Trend & Dynamic Support/Resistance)
The Ichimoku Cloud is used to confirm trend direction:
• Baseline (Kijun-sen) acts as a key trend filter.
• Senkou Span A & B form the cloud (Kumo), indicating dynamic support/resistance.
• Buy signals require price to be above the baseline, while sell signals require price to be below the baseline.
⸻
Trading Signals & Visual Elements
✅ BUY Signal (Green Arrow)
Occurs when:
• A Bullish Wave N forms
• J > 50 (Bullish KDJ Signal)
• Volume is above EMA threshold
• Price is above the Ichimoku Baseline
❌ SELL Signal (Red Arrow)
Occurs when:
• A Bearish Wave N forms
• J < 50 (Bearish KDJ Signal)
• Volume is above EMA threshold
• Price is below the Ichimoku Baseline
⚠️ Early Warning (Trend Shift Signal)
• An early warning appears when J crosses 50, indicating a possible upcoming trend shift.
• The line color changes based on the potential move:
• Green/Blue → Possible Uptrend
• Red/Orange → Possible Downtrend
⸻
Why This Indicator is Unique?
Unlike simple trend-following indicators, this script:
• Combines Price Action, Momentum, Volume, and Institutional Order Flow for a multi-dimensional approach.
• Filters out weak signals using volume confirmation and Ichimoku.
• Provides early warnings before major trend shifts.
• Visualizes Smart Money Order Blocks, giving traders an edge in spotting institutional zones.
⸻
Best Timeframes & Markets
📊 Recommended Timeframes:
• 1H & 1D (works best on medium/long-term trends)
💹 Markets:
• Crypto, Forex, and Stocks
This indicator is designed for traders who value confluence and strong confirmation in their strategies. Whether you are a trend trader, swing trader, or institutional flow analyst, this tool can help refine your decision-making process.
🚀 Optimize your trades with Wave N + KDJ + Volume + SMC + Ichimoku! 🚀

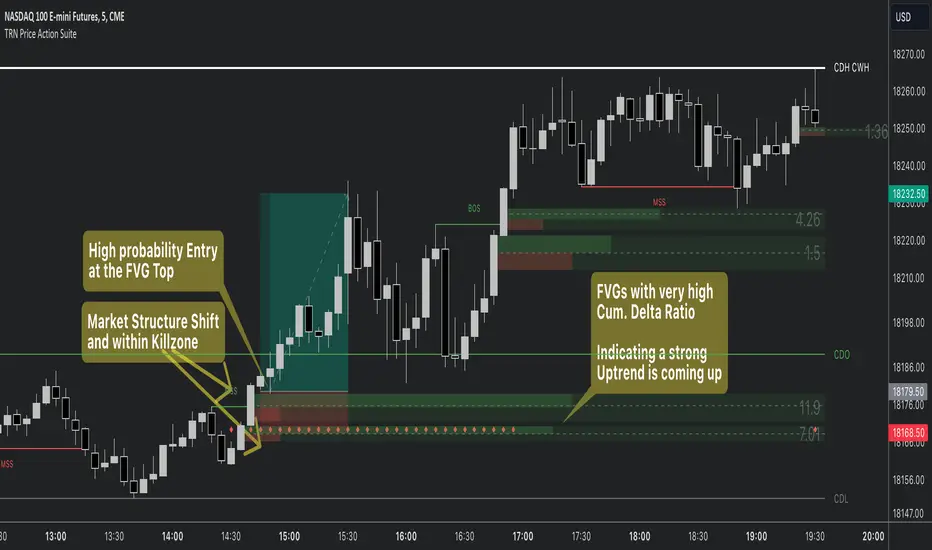
Price Action SuiteThe TRN Price Action Suite incorporates a treasure trove of time and price action concepts. It includes a set of trading tools that, when combined, allow for a more accurate view of the market. This enables traders to find high probability entry points before the market moves to the next liquidation level.
Features of the TRN Price Action Suite:
(Inverse) Fair Value Gaps (FVG)
Order Blocks (OB)
FVG and OB with Cumulative Volume Delta
Volume Imbalances
Market Structure
Liquidity levels
Sessions
Kill zones/Opening Range
The indicator helps traders to easily identify favorable market conditions and high probability trade setups. It automatically finds time and price action concepts and displays them in an intuitive way on the chart. One of the highlights is the detection of Fair Value Gaps and Order Blocks in connection with Cumulative Volume Delta (approx.). You will not find this connection anywhere else.
Fair Value Gaps (FVGs)
A fair value gap occurs when there are inefficiencies in the market or imbalanced buying and selling pressures. Fair value gaps can become a magnet for the price before continuing in the same direction. Special attention should be paid to FVGs that are supported by support and resistance levels, as these offer a higher probability of success for trades. Additionally, the indicator plots inverse FVG (iFVG). These are FVG that are “closed” by a FVG in the other direction. IFVGs are a strong sign of the market to continue in the direction of the iFVG.
In addition to the FVGs you see on the chart, you can add also FVGs from a higher timeframe including the cumulative buy/sell volume. For this you can set “Timeframe 1” and “Timeframe 2” in the settings to your preferred timeframes. E.g. you trade on a 5-minute chart, and you want to see FVGs from 4 hours and a daily chart, then you set Timeframe 1 to 4 h and to Timeframe 2 to 1 D.
Order Blocks and Volume Imbalances can also be shown from higher timeframes.
Order Blocks (OBs)
Order blocks are areas on the chart where a high concentration of limit orders was found in the past. They can serve as potential support or resistance areas. These represent areas in the market where there is an oversupply (supply) or an excess demand (demand). They are often key zones for potential turning points or continuations of the current trend. A bullish OB, for example, is the last bearish candle before a significant uptrend.
FVGs and OBs with Cumulative Volume Delta
The TRN Price Action Suite can show FVGs and OBs with the corresponding Cumulative Volume Delta (CVD). It is a metric to analyze market dynamics by tracking the net difference between buying and selling volumes over a specific timeframe. It is used to determine the strength of the FVG/OB. The FVG/OB includes two bars on the left side, indicating the cumulative buy volume in green as well es the cumulative sell volume in red. At the right side of the FVG/OB box the ratio of the cumulative buy/sell volume is displayed. A high ratio over 1, for example 1.5, indicates a lot of buying pressure. On the hand, a ratio far below 1, for example 0.66, indicates a lot of selling pressure.
Volume Imbalances (VIBs)
Volume Imbalances indicate a price gap from the previous close, but unlike gaps, there is no absence of trading activity within a specific price range. Bullish VIs have opening and closing prices above the previous close, with overlap between the current low and previous high. Bearish VIs are vice versa.
Market Structure
The market structure represents the dominant trend in the market. It is based on swing highs and lows. For instance, if the price makes higher highs (HH) and higher lows (HL) the market structure represents an uptrend. Vice versa if price makes lower lows (LL) and lower highs (LH) the market trend is down.
If the market structure is up, traders can enter positions in a pullback. For this, a trader could use a FVG or an OB as an entry condition.
Market Structure Shift (MSS) (Change of Character (ChoCh))
A market structure shift occurs when the market transitions from one dominant trend to a different one, often signaling a potential change in the underlying market dynamics. A MSS signals the start of a new trend. It signals the change from an uptrend to a down trend and vice versa. Therefore, it is sometimes called change of character (ChoCh). A valid MSS should ideally occur in a strong supply or demand zone. This indicates that the market may be approaching a trend reversal or consolidation.
Break of Structure (BOS)
A break of structure happens when the market breaks out of its established trading range or pattern. The market continues its dominant trend, indicated by the last MSS.
In an uptrend, for example, each time the price breaks through a new high, a "bullish BOS" is formed. This indicates that the market can overcome previous resistance levels and continue to rise.
Levels
One core concept in trading is that price flows to areas of liquidity. Natural liquidity areas are the current day open, high, low (CDO, CDH, CDL) or the previous day high, low, close (PDH, PDL, PDC). The same is true for the current week (CWO, CWH, CWL) and the previous week (PWH, PWL, PWC).
Pay special attention in case some of these levels are close together. Then these levels serve like a magnet for the price. The TRN Price Action Suite indicator can cluster these levels fully automatically together to give the trader the flexibility to focus solely on the trading part.
Sessions
Sessions are the trading hours during which the banks are actively trading. The three main trading sessions:
Asia: Most of the volume from the Asian players are handled within this session.
London: This is where the European players are most active.
New York: In the New York session all the USA players are active as well as all the other American players. Furthermore, a lot of global players are active in this session as well.
Killzones
A kill zone in trading refers to a specific time period during the trading day when the market experiences increased volatility and liquidity. It is an opportunity for traders to capitalize on potential price movements and generate profits. There are several different killzones during the day.
There are three different types of killzones:
Indices/Futures: This one is suitable if you trade products like the ES, NQ, FDAX, CL or Stocks, Options.
Forex: If you trade Forex this setting will mark the most liquid periods of the day.
Opening Range: In case you trade the opening range of the sessions, use this setting.
Trading Example
[KVA] ICT Dealing rangesNaive aproach of Dynamic Detection of Dealing Ranges:
The script dynamically identifies dealing ranges based on sequences of upward or downward price movements. It uses arrays to track the highest highs and lowest lows after detecting two consecutive up or down bars, a fundamental step towards understanding market structure and potential shifts in momentum.
ICT Concept: Order Blocks & Fair Value Gaps. This aspect can be linked to the identification of order blocks (bullish or bearish) and fair value gaps. Order blocks are essentially the last bearish or bullish candle before a significant price move, which this script could approximate by identifying the highs and lows of potential reversal zones.
Red and Green Ranges for Bullish and Bearish Movements:
The script separates these movements into red (bearish) and green (bullish) ranges, effectively categorizing potential areas of selling and buying pressure.
ICT Concept: Liquidity Pools. Red ranges could be indicative of areas where selling might occur, potentially leading to liquidity pools below these ranges. Conversely, green ranges might indicate potential buying pressure, with liquidity pools above. These areas are critical for ICT traders, as they often represent zones where price may return to "hunt" for liquidity.
Horizontal Lines for High and Low Points:
The indicator draws horizontal lines at the high and low points of these ranges, offering visual cues for significant levels.
ICT Concept: Breaker Blocks & Mitigation Sequences. The high and low points of these ranges can be seen as potential breaker blocks or areas for future mitigation sequences. In ICT terms, breaker blocks are areas where institutional orders have overwhelmed retail stop clusters, creating potential entry points for trend continuation or reversal. The high and low points marked by the indicator could serve as references for these sequences, where price might return to retest these levels.
Customizability and Historical Depth:
With inputs like rangePlot and maxBarsBack, the indicator allows for customization of the number of ranges to display and how far back in the chart history it looks to identify these ranges. This flexibility is crucial for tailoring the analysis to different trading strategies and timeframes.
ICT Concept: Market Structure Analysis. The ability to adjust the depth and number of ranges plotted caters to a detailed market structure analysis, an essential component of ICT methodology. Traders can adjust these parameters to better understand the distribution of buying and selling pressure over time and how actions have shaped price movements.

SME Backtesting [TFO]This strategy script is an extension of my Smart Money Essentials (SME) indicator and aims to provide a simplified means of backtesting complex trade models that incorporate a variety of Smart Money Concepts.
Among other things, Smart Money Essentials contains logic for:
- Market structure
- Fair Value Gaps
- Order Blocks
- Breaker Blocks
- Optimal Trade Entries
- HTF Market Structure
The Confluence section can then be utilized to build and test trade models from any combination of the included factors. As a basic example, we could test a strategy that only utilizes market structure. With Manual Exit turned off, we would simply be flipping long on bullish market structure shifts, and reversing short on bearish market structure shifts for the duration of the user-defined session.
As one might expect, such a simple strategy isn't expected to produce very reliable results by itself. However, we could build on these ideas by adding extra layers of Confluence, like looking for entries where Market Structure aligns with Order Block interactions. We could also turn on Manual Exit with a 40 tick stop loss and 80 tick profit target (10 points and 20 points, respectively, for ES futures), for more defined exit criteria.
One could expand on these ideas by adding factors like Fair Value Gaps, HTF Market Structure, etc. Any of the core pieces of SME can be used to build and backtest strategies that would otherwise be extremely tedious to do by hand, and as the SME indicator grows, so too will this backtesting script. Ultimately, the purpose of this is to make Smart Money Concepts more objective and easily testable so that users may better understand where these concepts may perform best.

Bodies X Wix Version of Smart Money Tools by makuchaku & eFeThis is the same Script as Super Fair Value Gaps / FVG /BoS / by makuchaku & eFe. Mine Should Default to Large Text instead of small. The Super Order Blocks I believe was meant to for you to find one of the many Smart Money tools such as turn on the Fair Value gap but leave the others off, or Turn on where the Break of Structure and leave the others off. The reason I believe this is because the default values for each of the structures were default colored (green for positive and red for negative) for all.
Mine has a different Color for every possible structure. As long as you can read with the larger text that I added, then you can create your own boxes positive for break of structure, rejection block, order blocks and fair value gaps for any time frame. The reason I did that is because There's only certain things I believe I will need to mark for myself in each time frame, and then from there You can stretch iyour own box out further in time because if price touches a fair value gap for example, the fair value gap should conyinue in time until at least 2 candles have filed the Fair valu gap going both directions. That's truly when the fair value gap should is mitigated and will from off the chart. However, If I knew How to add the code for that, I would.
Additionally, I have the Max Boxes per chart, so you should have the ability to see every OB, FVG,RJB, & BoS on the chart
I tried my hardest to create a colored border that was different from the box. But the way the original was coded was almost impossible to do. Because they defined each of the structures (FVG, OB, BoS, RJB) outer levels, when the outer levels connect via math in the code, then it joins all the outside lines for a rectangle. When creating a box, the coloe will always be the same as the border unfortunately. (Unless I replan this from the beginning)
I also Changed the default labels for reach structure from a hard to read gray to a white that pops out.
Also, chart indicators are a little large as well. Such as the cross, sideways cross, The green Triangle, and the white Diamond. You'll get used to it or you can change it as well.
Creating videos for students, you need something they can see.
So, I just wanted to ensure everything was a little more unique and easily usable when showing this to my students when I send them private videos for our weekly lessons. I'm trying to learn how to use the IPFS for THAT, (which i see has invaded PineScript) Hope this indicator helps.
If you're to borrow this, Just make sure you keep the authors in the name makuchaku & efe

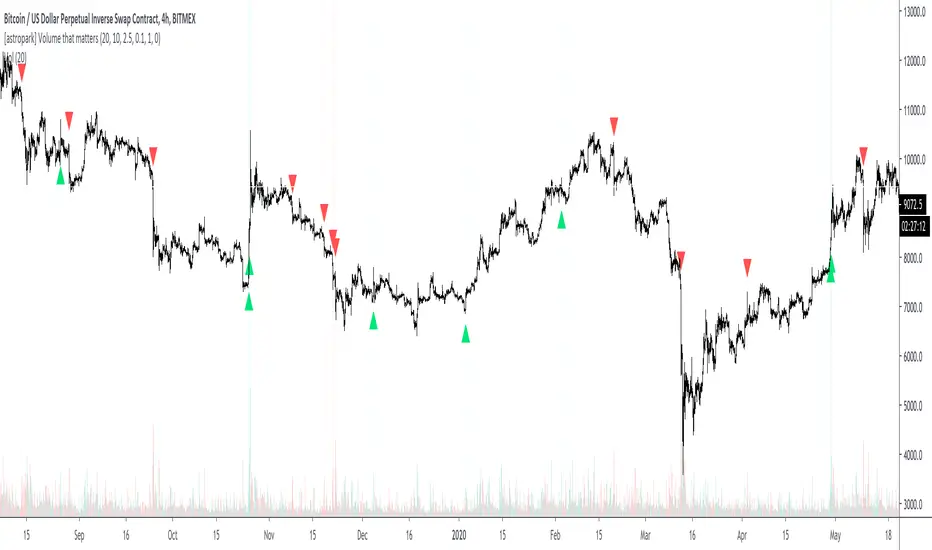
[astropark] Volume that mattersDear Followers,
does volume say something about market makers and what will happen in near future?
Today a new Price Action Tool , the "Volume that matters" indicator.
When a Market Maker executes his/her orders, there is no way he/she can do it without giving us some footprints: volume!
Specific Volume spikes happen as
reactions at support or resistance range , as well as at supply and demand zones
market makers' actions
trend switching in short-term and mid-term future
They can be both bullish or bearish , but the real problem is that not all, but only a few volume candle matters ! And this tool will filter them for you.
This indicator works
on every timeframe (eg. 15m, 30m, 1h, 2h, 4h, 6h, 1D, ...), the higher, the better!
on cryptocurrencies (eg. XBTUSD, ETHUSD, ETHBTC, both USDT and BTC markets, ...)
on forex (eg. EURUSD, GPBUSD, JPYUSD, ...)
on stocks (eg. AMZN, FB, TSLA, GOOG, NFLX, ...)
on commodities (eg. GOLD, SILVER, OIL, ...)
This indicator has following options:
edit volume filter and period analysis
edit filter based on fixed or percentage volatility change
edit filter based on candle value size
show a suggestion of possible entries and stoploss
You can enhance your trading by using it together with my "Engulfing that matters", my "Pinbar that matters" and my "Breaker Blocks (BB) and Supply/Demand Order Blocks (OB)" indicators, so you can easily spot confluences and have more confidence in trades.
Here my Engulfing that matters indicator
Here my Pinbar that matters indicator
Here my Breaker Blocks (BB) and Supply/Demand Order Blocks (OB) indicator
Here below some examples on how to use the indicator.
BTCUSDT 1D
ETHUSD 4h
LINKBTC 1h
EURUSD 4h
AMZN 1h
XAUUSD 4h
Here below an example of suggested entries and stoploss
This is a premium indicator , so send me a private message in order to get access to this script .
[astropark] Pinbar that mattersDear Followers,
today a new Price Action Tool , the "Pinbar that matters" , also known as Hammer (bullish case) and Inverted Hammer (bearish case).
Everybody knows the importance of pinbar to highlight
reaction at support or resistance range , as well as at supply and demand zones
market makers' actions
trend switching in short-term and mid-term future
They can be both bullish or bearish , but the real problem is that not all, but only a few pinbar matters ! And this tool will filter them for you.
This indicator works
on every timeframe (eg. 5m, 15m, 30m, 1h, 2h, 4h, 6h, 1D, ...)
on cryptocurrencies (eg. XBTUSD, ETHUSD, ETHBTC, both USDT and BTC markets, ...)
on forex (eg. EURUSD, GPBUSD, JPYUSD, ...)
on stocks (eg. AMZN, FB, TSLA, GOOG, NFLX, ...)
on commodities (eg. GOLD, SILVER, OIL, ...)
This indicator has following options:
edit filter based on fixed or percentage volatility change
edit filter based on candle value size
show a suggestion of possible entries and stoploss
Be sure to edit both fixed and percentage volatility options in order to have a correct filter on your chart and timeframe.
You can enhance your trading by using it together with my "Engulfing that matters" and my "Breaker Blocks (BB) and Supply/Demand Order Blocks (OB)" indicators, so you can easily spot important points where to start a short or a long trade.
Here my Engulfing that matters indicator
Here my Breaker Blocks (BB) and Supply/Demand Order Blocks (OB) indicator
Here below some examples on how to use the indicator.
XBTUSD 5m
ETHUSD 15m
BNBBTC 1h
ETHBTC 12h
EURUSD 1h
JPYUSD 4h
AMZN 5m
FB 4h
XAUUSD 15m
Copper Futures 1h
Here below an example of suggested entries and stoploss
This is a premium indicator , so send me a private message in order to get access to this script .

SMA_magistratura⚜️ Custom Indicator "SMA_Magistratura" — Why It’s Better Than Classic Indicators
🔹 Moving to advanced strategies
— But before we dive in, it’s essential to understand:
→ What a classic indicator is,
→ And how it differs from a custom-built one.
🔹 Example with classic SMA
— Open the BSPR stock (Bank Saint Petersburg),
— Add several Simple Moving Averages (SMA):
9, 21, 50, 100 periods,
→ Each is a separate indicator,
→ Takes up space and requires individual setup,
→ And may repaint or shift slightly over time.
📌 The problem:
— TradingView limits the number of indicators per chart,
— The more you add — the higher the chance of hitting the subscription limit,
→ Forcing you to upgrade to a more expensive plan.
🔹 Comparison with EMA (Exponential Moving Average)
— EMA reacts faster to price changes,
— But it repaints over time,
→ If you placed an order based on EMA yesterday — today it might appear in a different place.
→ This is its main drawback.
🔹 Why did we create our own indicator?
— To save time and money,
— To avoid cluttering the chart,
— To see everything at once: all SMAs and Order Blocks in a single tool.
🔹 How SMA Magistratura works
— We use a color-coded system for each timeframe:
1 hour — purple,
4 hours — black/white,
1 day — aqua,
1 week — peach,
1 month — maroon,
3 months — brown.
→ Easy to remember, simple to navigate.
🔹 Why is it better than classic SMA?
→ All moving averages are locked in place,
→ They don’t shift when switching timeframes,
→ When moving to lower timeframes — lower SMAs appear, higher ones remain visible,
→ When moving to higher timeframes — lower SMAs disappear, keeping the chart clean.
📌 Key benefit:
→ Minimizes visual noise,
→ Everything is fixed, stable, and does not repaint,
→ Helps make clear, confident trading decisions.
🔹 Additional features of SMA Magistratura
— Includes a built-in Order Block module,
— Highlights zones where order clusters formed,
→ Directly integrated into the indicator.
📌 All of this — in one single tool.
🔹 Why is this the best choice?
— Saves time,
— Frees up chart space,
— Increases analysis accuracy,
— Enables complex strategies without overload.
🔹 Conclusion:
— Classic indicators are useful — but inefficient for large-scale trading,
— The SMA Magistratura is a clear, structured system with real advantages.
💡 Use it — and you’ll see the market more clearly, and trade with greater confidence.
ICT SMC By VIPIN | Volume OB + BOS, CHoCH, FVG, Sweep VTTitle:
Smart Money Concepts Pro – OB, FVG, BOS, CHoCH & Liquidity Sweep
Description:
This indicator is built on Smart Money Concepts (SMC) and is designed to help traders analyze market structure in depth. It identifies institutional trading levels, potential reversal points, and high-probability trade setups using advanced price action techniques.
Key Features:
1. Order Blocks (OB) – Detects and marks bullish and bearish order blocks to identify possible reversal and continuation zones.
2. Fair Value Gaps (FVG) – Highlights price imbalances that often attract price retracements.
3. Break of Structure (BOS) – Marks structural breaks that confirm trend continuation.
4. Change of Character (CHoCH) – Signals early signs of trend reversal.
5. Liquidity Sweep – Highlights buy-side and sell-side liquidity grabs to identify stop hunts and false breakouts.
6. Custom Styling & Filters – Users can customize colors, sizes, and filter settings for better clarity.
How It Works:
• The indicator automatically detects market structure (HH, HL, LH, LL) and identifies BOS and CHoCH based on price movement.
• Order Blocks are filtered using past price action and volume confluence to show only significant zones.
• Fair Value Gaps and Liquidity Sweeps are detected with a smart logic system for improved accuracy.
How to Use:
• Use higher timeframes (H1, H4, Daily) to determine the main trend and lower timeframes (M15, M5) for entries.
• Combine Order Blocks and FVGs for strong confluence.
• Wait for BOS/CHoCH confirmations along with liquidity sweep signals before entering trades.
Disclaimer:
This tool is for chart analysis assistance only. Always conduct your own research and apply proper risk management before trading.

RSI Support & Resistance Breakouts with OrderblocksThis tool is an overly simplified method of finding market squeeze and breakout completely based on a dynamic RSI calculation. It is designed to draw out areas of price levels where the market is pushing back against price action leaving behind instances of short term support and resistance levels you otherwise wouldn't see with the common RSI.
It uses the changes in market momentum to determine support and resistance levels in real time while offering price zone where order blocks exist in the short term.
In ranging markets we need to know a couple things.
1. External Zone - It's important to know where the highs and lows were left behind as they hold liquidity. Here you will have later price swings and more false breakouts.
2. Internal Zone - It's important to know where the highest and lowest closing values were so we can see the limitations of that squeeze. Here you will find the stronger cluster of orders often seen as orderblocks.
In this tool I've added a 200 period Smoothed Moving Average as a trend filter which causes the RSI calculation to change dynamically.
Regular Zones - without extending
The Zones draw out automatically but are often too small to work with.
To solve this problem, you can extend the zones into the future up to 40 bars.
This allows for more visibility against future price action.
--------------------------------------------
Two Types of Zones
External Zones - These zones give you positioning of the highest and lowest price traded within the ranging market. This is where liquidity will be swept and often is an ultimate breaking point for new price swings.
How to use them :
External Zones - External zones form at the top of a pullback. After this price should move back into its impulsive wave.
During the next corrective way, if price breaches the top of the previous External Zone, this is a sign of trend weakness. Expect a divergence and trend reversal.
Internal Zones - (OrderBlocks) Current price will move in relation to previous internal zones. The internal zone is where a majority of price action and trading took place. It's a stronger SQUEEZE area. Current price action will often have a hard time closing beyond the previous Internal Zones high or low. You can expect these zones to show you where the market will flip over. In these same internal zones you'll find large rejection candles.
**Important Note** Size Doesn't Matter
The size of the internal zone does not matter. It can be very small and still very powerful.
Once an internal zone has been hit a few times, its often not relevant any longer.
Order Block Zone Examples
In this image you can see the Internal Zone that was untouched had a STRONG price reaction later on.
Internal Zones that were touched multiple times had weak reactions later as price respected them less over time.
Zone Overlay Breakdown
The Zones form and update in real time until momentum has picked up and price begins to trend. However it leaves behind the elements of the inducement area and all the key levels you need to know about for future price action.
Resistance Fakeout : Later on after the zone has formed, price will return to this upper zone of price levels and cause fakeouts. A close above this zone implies the market moves long again.
Midline Equilibrium : This is simply the center of the strongest traded area. We can call this the Point of Control within the orderblock. If price expands through both extremes of this zone multiple times in the future, it eliminates the orderblock.
Support Fakeout : Just like its opposing brother, price will wick through this zone and rip back causing inducement to trap traders. You would need a clear close below this zone to be in a bearish trend.
BARCOLOR or Candle Color: (Optional)
Bars are colored under three conditions
Bullish Color = A confirmed bullish breakout of the range.
Bearish Color = A confirmed bearish breakout of the range.
Squeeze Color = Even if no box is formed a candle or candles can have a squeeze color. This means the ranging market happened within the high and low of that singular candle.

Four-Color Order Flow System Four-Color Order Flow System – Smart Money Liquidity Tracking
Revolutionizing Market Structure with a Four-Color Candle System
Traditional candlestick charts lack real-time liquidity visibility, forcing traders to rely on lagging indicators. The Four-Color Order Flow System solves this by integrating Order Blocks (OBs), Accumulation/Distribution (AD), Swing High/Low (SH/SL), and Delta metrics directly into the candle structure. This mashup of volume, price action, and liquidity flow gives traders an intuitive and immediate read on market conditions.
📌 Key Features & How They Work Together
🔹 Four-Color Candles – A Visual Edge Over Traditional Charts
Instead of basic red/green candles, we introduce a four-color system to highlight key liquidity shifts:
• 🔴 Red – Bearish pressure, aggressive sellers dominating.
• 🟢 Green – Bullish pressure, buyers stepping in.
• 🔵 Blue – Swing Highs (SH), Bullish Order Blocks (OBs), Accumulation zones.
• 🟡 Yellow – Swing Lows (SL), areas of liquidity sweep or potential reversal.
This eliminates the need to switch between multiple indicators—price structure, liquidity zones, and order flow are embedded directly into the chart.
🔹 EMA Logic – The Trend Foundation
The EMA acts as the core trend filter, dynamically adjusting to market bias. When combined with delta and liquidity flow, it helps traders confirm whether price action aligns with smart money movements.
🔹 Order Flow & Liquidity Mashup – What’s Really Moving the Market?
📊 Rolling Delta & Cumulative Delta – Track aggressive buyers/sellers and confirm if momentum is sustained or fading.
💰 Liquidity Flow & Shift – Shows whether market makers are accumulating or distributing, helping traders avoid fake breakouts.
📈 Money Flow Index & Value – Measures real institutional participation vs. retail noise.
These elements combine to validate price moves, making it clear when smart money is truly in control.
🔹 Swing Highs & Lows – Market Structure in Real-Time
SH/SL markers don’t lag behind multiple candles like in traditional indicators. Instead, they align with OBs and liquidity flow, giving a strong confirmation of trend continuation or reversal.
🔹 Live Label Update – Real-Time Market Intelligence
The dynamic label box provides a live feed of critical metrics, including:
✅ EMA Bias – Confirms market direction.
✅ Rolling & Cumulative Delta – Tracks aggressive buy/sell imbalances.
✅ Liquidity Flow & Money Flow Index – Confirms institutional strength.
✅ FVG Execution Scanning (Coming Soon!)
This ensures traders have instant insight into market conditions without needing to check multiple sources.
📈 Why Traders Need This System
🔹 Faster Decision-Making – No need to flip between indicators; everything is visible on the chart.
🔹 Clearer Liquidity Insights – Order flow, delta, and structure all in sync.
🔹 Works for Scalping & Day Trading – Designed for real-time execution, not lagging signals.
By integrating order blocks, liquidity shifts, and a four-color candle system, this tool provides the most complete view of market control in a single chart.
📌 Stop reacting. Start anticipating. Trade with the flow of smart money.

Whispr IQ - Trading SystemWhispr IQ - Trading System
This advanced multi-component indicator combines several powerful analysis tools to provide a comprehensive view of market conditions and potential trading opportunities.
Key Components:
Kernel Regression Ribbon
Institutional Order Flow
Volume Profile
Order Blocks
Swing Points and Liquidity
Naked POC (Point of Control)
Fibonacci Levels
Zig Zag Patterns
Divergence Scanner
Squeeze Bands
How It Works:
Kernel Regression Ribbon
Uses kernel regression to create a smoothed ribbon of price action
Multiple timeframes analyzed to show short, medium and long-term trends
Color coding indicates bullish/bearish bias
Institutional Order Flow
Identifies areas of high volume and potential institutional activity
Highlights order blocks, liquidity levels, and fair value gaps
Helps visualize potential support/resistance zones
Volume Profile
Displays volume distribution at different price levels
Identifies high volume nodes and value areas
Useful for determining potential reversal points
Order Blocks
Highlights significant swing highs/lows with high volume
Indicates potential areas where large players may have placed orders
Useful for identifying key support/resistance levels
Swing Points and Liquidity
Marks major swing highs and lows
Highlights areas of potential liquidity buildup
Helps identify trend changes and potential reversal zones
Naked POC
Shows uncovered Points of Control from volume profile analysis
Indicates areas of high trading activity that price has moved away from
Potential magnet for price to return to
Fibonacci Levels
Plots key Fibonacci retracement and extension levels
Useful for identifying potential support, resistance and targets
Multiple Fibonacci sequences used for confirmation
Zig Zag Patterns
Identifies key swing highs and lows
Filters out minor price movements
Helps visualize overall trend structure
Divergence Scanner
Scans for regular and hidden divergences on multiple indicators
Signals potential trend reversals or continuations
Configurable to scan RSI, MACD, CCI and other oscillators
Squeeze Bands
Identifies periods of low volatility (squeezes)
Signals potential for explosive moves when volatility expands
Based on Bollinger Bands and Keltner Channel relationships
The Whispr IQ system combines all these elements to provide a holistic view of market conditions. Traders can use the various signals and overlays to identify high-probability trade setups, key support/resistance levels, trend direction on multiple timeframes, and potential reversals.
This indicator is designed for experienced traders who can interpret the multiple data points and use them in conjunction with their own analysis and risk management. It's a powerful tool that can enhance trading decisions when used properly as part of a complete trading plan.
Candlesticks Patterns [TradingFinder] Pin Bar Hammer Shooting🔵 Introduction
Truly, the title "TradingView" doesn't do justice to this excellent website, and that's why I've written about its crucial aspect. In this indicator, the identification of all candlesticks known as "Pin bars" is explored.
These candlesticks include the following:
- Hammer : A Pin bar formed at the end of a bearish trend, with its body being either bearish or bullish.
- Shooting Star : Formed at the end of a bullish trend, with its body being either bearish or bullish.
- Hanging Man : Formed during an upward trend, characterized by a candle with a lower shadow.
- Inverted Hammer : Formed during a downward trend, characterized by a candle with an upper shadow.
🟣 Important : For ease of use, we refer to these four candlestick patterns as Pin Bars and categorize them into the main friends "Bullish" and "Bearish."
🟣 Important : In all sources, Hanging Man and Inverted Hammer are referred to as "Reversal candles." However, in reality, whenever they appear after breaking a significant area (Break Out), we expect these candles to signal a continuation of the trend and confirmation in the direction of the trend.
🟣 Important : One of the best signs of market manipulation and entry by market giants is the "Ice Berg." So, it provides one of the best trading opportunities.
🔵 Reason for Creation
Many traders, especially volume traders, use Pin bars as confirmation and enter the market after their occurrence. In this indicator, all four patterns are identified and displayed in a colored candle format, using "triangle" and "circle."
When they are evident on the chart, directly or by drawing a horizontal line, they give us good alerts for reversal or continuation areas.
🔵 Information Table
1. Red circle: Pin bars formed in a downtrend.
2. Blue circle: Bullish Pin bars formed in an uptrend.
3. Black triangle: Bearish Pin bar candle in an uptrend.
4. Blue triangle: Bullish Pin bar candle in a downtrend.
🔵 Settings
Trend Detection Period: A special feature that considers smaller or larger fluctuations. If individual price waves need to be considered, use lower numbers; if the overall trend direction is desired, use larger numbers (e.g., 5-7 or higher). This precisely sets the Zigzag or Pivot format, not displayed but considered in the indicator calculation.
Trend Effect : By changing the Trend Effect status to "Off," all Pin bars, whether bullish or bearish, are displayed regardless of the current market trend. If the status remains "On," only Pin bars in the direction of the main market trend are shown.
🟣 Important : Black triangles "Number 3" and blue triangles "Number 4" displayed in the information table section, as explained in the "Information Table" section.
Show Bullish Pin Bar : When set to "Yes," displays bullish Pin bars; when set to "No," does not display them.
Show Bearish Pin Bar : When set to "Yes," allows the display of bearish Pin bars; when set to "No," does not display them.
Bullish Pin Bar Setting : Using the "Ratio Lower Shadow to Body" and "Ratio Lower Shadow to Higher Shadow" settings, you can customize your bullish Pin bar candles. Larger numbers impose stricter conditions for identifying bullish Pin bars.
Bearish Pin Bar Setting : Using the "Ratio Higher Shadow to Body" and "Ratio Higher Shadow to Lower Shadow" settings, you can customize your bearish Pin bar candles. Larger numbers impose stricter conditions for identifying bearish Pin bars.
Show Info Table : Allows the display or non-display of the information table (located at the bottom of the page and on the right side).
🔵 How to Use
At the end of a downtrend, look for "Hammer" candles, easily identified one by one.
To identify the "Shooting Star" candle pattern at the end of an uptrend; expect a price reversal in the downtrend.
For trades in the downward direction, wait for the formation of an "Inverted Hammer" Pin bar.
And finally, in an uptrend, where a "Hanging Man" candle can form.
🔵 Features
For better visualization, triangles and circles are used above the candles, but they can be easily removed. All Pin bars are displayed in color with the following meanings:
- Black-bodied candle: Inverted Hammer
- Turquoise blue candle: Hammer
- Pink candle: Hanging Man
- Red candle: Shooting Star
🟣 Important : The capability to detect the powerful two-candle pattern "Tweezer Top" at the end of an uptrend emerges by forming two "Shooting Star" candles side by side.
Similarly, the two-candle pattern "Tweezer Bottom" is created at the end of a downtrend with the formation of two "Hammer" candles side by side. To identify the "Tweezer" pattern, make sure the settings in the "Trend Effect" section are set to "Off."
🟣 Auxiliary Indicators
During the start of trading sessions such as Asia, London, and New York, where the highest liquidity exists, alongside this indicator, you can use the Trading Sessions indicator.
Sessions
The combination of Order Blocks "-OB" and "+OB" with candles is one of the best trading methods. The indicator that identifies order blocks, along with this indicator, can yield remarkable results in the success of Pin bar candles.
Order Blocks Finder
The trading toolset "TFlab" presents this indicator. To benefit from all indicators, we invite you to visit our page " TFlab Scripts ".
